
|
A choice of operation system is very important for such a software like the NRV.
Unfortunately there is no a unified operation system used by all physicists.
Some people work with UNIX, others prefer Windows.
The first version of the NRV worked under MS DOS.
It forced us to make a lot of special utilities for management with mouse, graphical
screen, and other devices. Later (1995) we chose Windows as basic operation system for the NRV because, as it seems to us, there is more advanced and faster developing software created just under Windows. As it is known, this operation system is supported now not only by IBM but also by Macintosh personal computers. Using C++ as a main coding language (Borland C++ compiler under Windows) we obtain a powerful tool for building our main classes of graphical support (including 3-dimentional ones), numerous interface dialogs, handling the database, and all the algorithms of nuclear dynamics. The BDE_IDAPI SDK and IDAPI functions are used in the work with our database. The DBF representation of the experimental data on nuclear properties is sufficiently convenient to work with them and can be easily changed if some other format would be found to be more appropriate for a net version of the NRV. At present all experimental data are divided in several DBF-tables (masses, modes of decay, energy levels, and so on) which can be downloaded separately in case of need. These data can be renewed and edited directly using the basic external databases or some other sources of information. All the algorithms of nuclear dynamics (see below) are written with C++ and formed as real Windows applications, i.e., they can start and operate independently, but they all rest on the same database and have a common starting interface. It means that analyzing, for example, collision of nuclei A and B within different models (elastic scattering, fusion, transfer reaction,...) one automatically uses the same interaction parameters and other properties of both nuclei in the entrance channel. Main advantages of the Windows 95/NT operation system are the following.
|
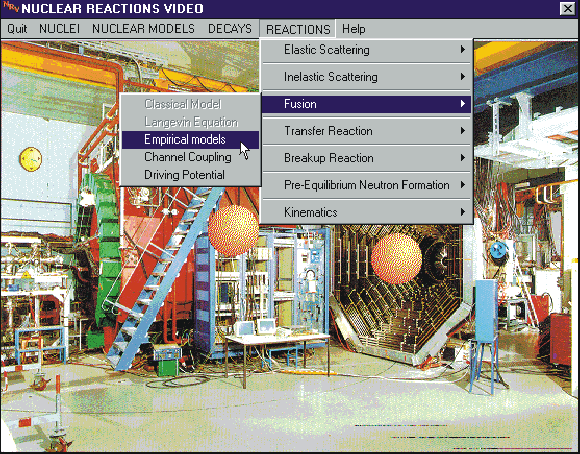
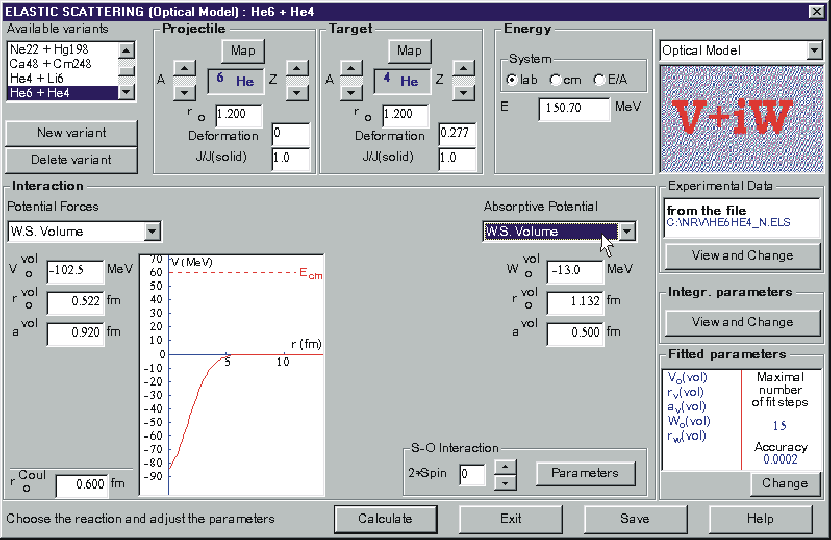
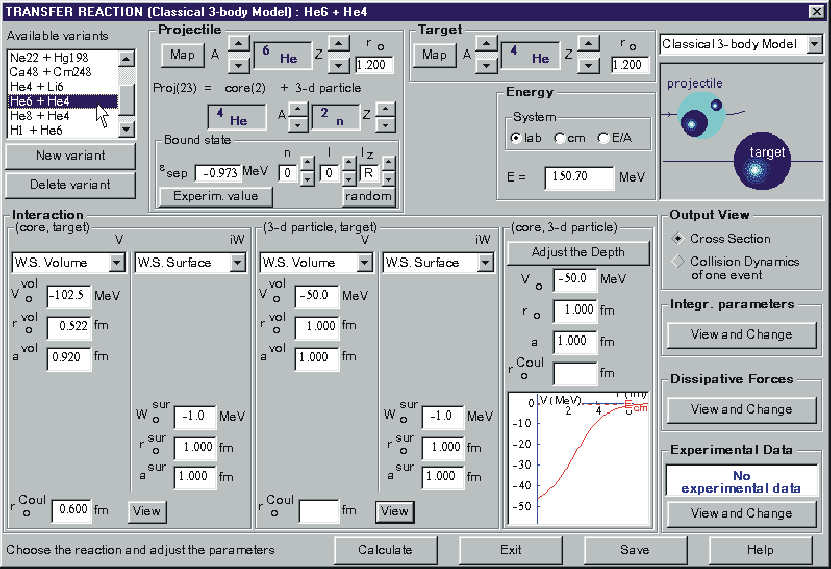
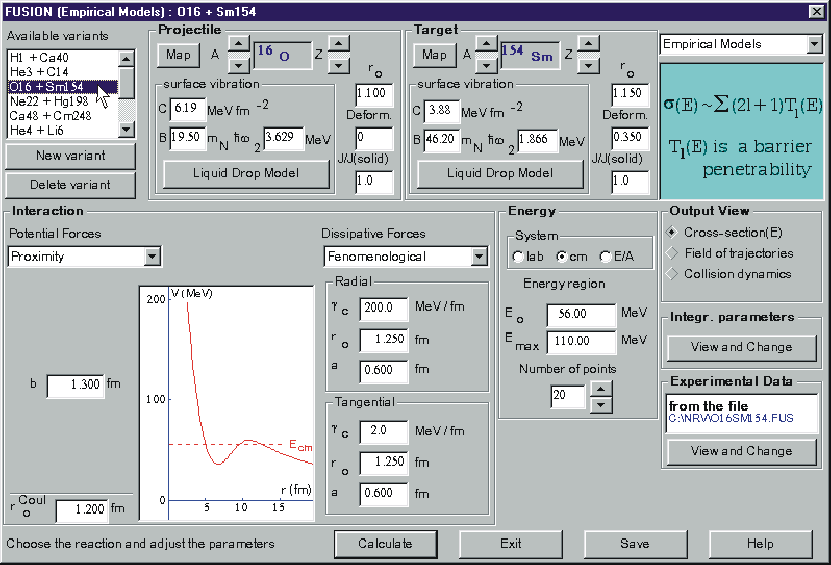
| The graphical interface of the main menu - Fig.1 - is a common "entrance point" to the NRV. In spite of the fact that all the models are prepared as self-dependent Windows applications and can be started separately, one has to pass this "entrance point" if you want to analyze some process of collision within different approaches keeping the same values of all common parameters of colliding nuclei. It means that the "Input Dialogs" of all the models look very similar to each other and operate with the same set of accumulated variants of different reactions studied by a user of the NRV (see Figs.2 - 4 as examples). Any variant can be changed, deleted, or added to the database only within the main program of the NRV, which, thus, performs the duties of a dispatcher. As can be seen from Figs.2 - 4, there are many common input parameters for different reaction channels of the nucleus-nucleus collision: projectile-target interaction, energy of collision, some properties of colliding nuclei. Thus, it is quite reasonable to have a common DBF table, every line of which completely defines one of the studied collision processes, i.e., all the parameters of the entrance channel and different exit channels. |
|
Nuclear database of the NRV consists of three correlated DBF tables containing such
properties of atomic nuclei as mass excess and its error, spin, parity, half-life
and modes of decay of the ground and metastable states, electromagnetic properties,
excited states (energy, spin, parity, half-life), cross section for thermal neutron,
g-lines, and a-decay energies. The structure of these tables allows one to edit them
separately and, in particular, add some new characteristics of nuclei. All the data are
prepared in the numerical form and can be easily treated inside the codes of the NRV. There are three main differences between our database of experimental nuclear properties and other well-known nuclear databases [1-8]. (i) All the properties of a given nucleus are shown in one window. (ii) These properties are presented in a visualized graphical form. (iii) A user can easily process these data obtaining additional information (Q-values, decay chains, systematic on any quantity over a group of nuclei) and presenting results in the form he wants. In Fig.5 the Nuclear Map and the window of the chosen nucleus (here 242Am) are shown together with the dependence of the half-life on the atomic number for all known isotones with N=147 (as an example of one of numerous systematics which can be easily obtained by a simple click of a mouse). Unfortunately, these gray-scaled figures (and all others in the paper) are not so very well seen and easily-read as the corresponding multi-colored versions on a computer screen. Two other systematics (dependence of the energy of the first 2+ state and of a-particle separation energy on the atomic number of dysprosium isotopes) are shown in Fig.6. |

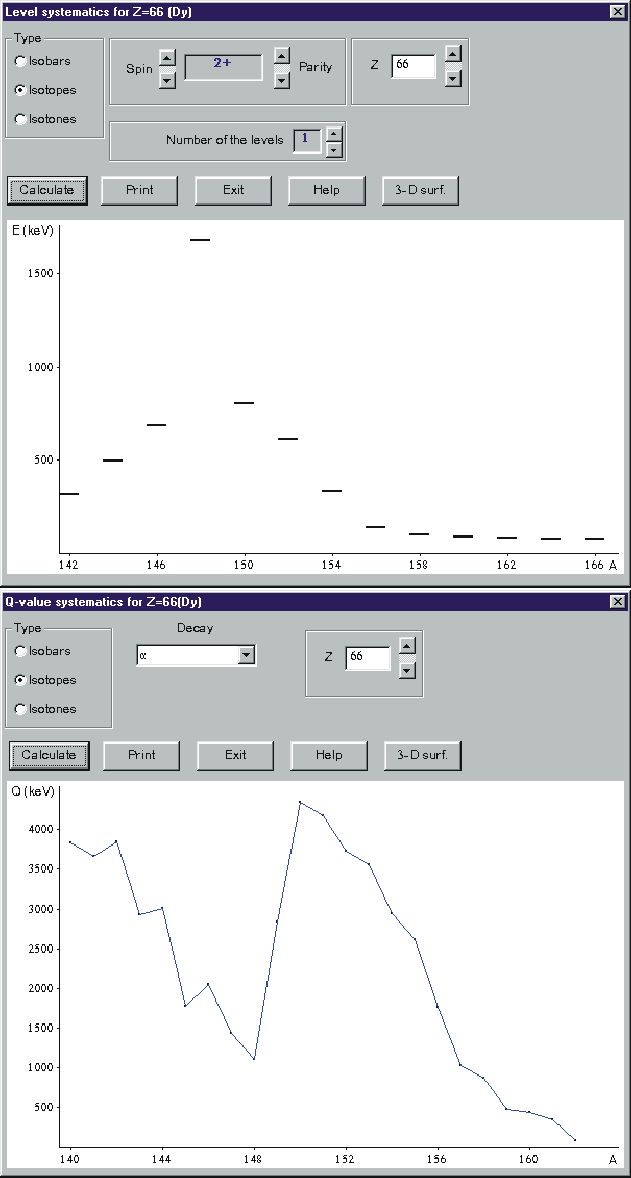
| Fig.6. | Two examples of numerous systematics which can be obtained within the NRV. Position of the first 2+ excited states (left) and separation energies of alpha-particles (right) plotted for different dysprosium isotopes. Both systematics obviously point to the effect of neutron shell with N=82. |
The main menu of the Windows version of the NRV
consists of the following hierarchic items leading to the basic nuclear models
and to processing nuclear data. Today some of the models of low energy nuclear
dynamics operate in full capacity, and others are under construction.
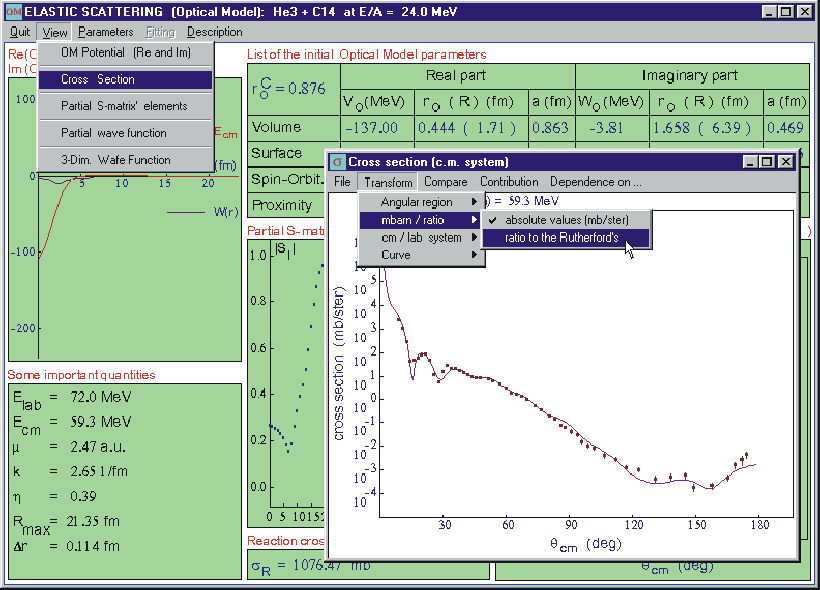
All the dynamical models are formed as real Windows applications with a maximal visualization of input data, dynamics of studied processes and final results by means of real 3-dimensional images, plots, tables and formulas, and a 3-dimensional animation. Extended menu, friendly graphical interface, hypertext description of the models, and animated screen transform the codes into a fascinating game for user in spite of complicated physical phenomena described by the models. Optical Model code of the NRV, for example, allows one to calculate and present in graphical and tabular forms such quantities as partial waves, partial matrix elements, total wave function in the 3-dimensional space, and the differential cross section (Fig. 7). An automatic search of the OMP parameters can be fulfilled with a fit of the calculated elastic scattering angular distribution to the available experimental data. Many additional possibilities are also included to the Optical Model code which allows one to analyze an investigated process in detail. Other models are formed in the same way (see details in [9]). |
| Special attention in the NRV is paid to a visualized presentation of all the quantities. In particular, internal graphic editor allows one to draw and handle 3-dimensional and topographical plots directly during the calculations, see Fig. 8 as an example. A user can choose an appropriate type of the surface (simple grid, multi-colored, lighted, 3-dimensional bars), rotate the surface, print it, or save the table for other applications. All the possibilities of the NRV graphical editor will be described in our forthcoming papers. |

| [1] | Atomic Mass Data Center (Orsay), G.Audi, A.H.Wapstra, Nucl.Phys., A595 (1995), 409; ibid. A624 (1997), 1. |
| [2] |
National Nuclear Data Center,
Brookhaven National Laboratory, T.W.Burrows. |
| [3] |
Nuclear Data Services,
Nuclear Energy Agency, France. |
| [4] |
IAEA's Nuclear Data Centre. |
| [5] |
Center for Photonuclear Experimental Data,
Moscow State University, V.V.Varlamov. |
| [6] |
Nuclear Data Center,
Japan Atomic Energy Research Institute. |
| [7] |
Lund Nuclear Data WWW Service,
P.Ekstrom. |
| [8] |
Isotopes Project, LBNL. |
| [9] |
V.Zagrebaev, A.Kozhin, Nuclear Reactions Video
(knowledge base on low energy nuclear physics), JINR Report No. E10-99-151,
Dubna, 1999. |